One of the many benefits of bonds is that they can be sold prior to their maturity date. Between the issuance date and the maturity date, the capital value of a bond can vary dramatically and by incorporating different trading strategies, investors can potentially generate better returns than by simply buying and holding. In this article, our Deputy Head of Research, Garreth Innes, discusses some of the strategies that can be used to maximise returns for a fixed income portfolio through actively trading positions.
Background
For my sins, I used to work as a bond portfolio manager (PM), largely focused on corporate credit. This note is designed to expose some of the typical methods a credit PM will utilise in assessing relative value on individual corporate bonds, and then
applying these methods to current market opportunities.
Credit PMs utilise a number of strategies to isolate the desired factors embedded in each bond and across a portfolio as a whole. Most of these methods are out of the scope of the average bond investor (over-the-counter interest rate and credit derivative
swaps, for example) but the approach to thinking about how to actively trade a bond portfolio can be understood and applied by all investors. Here we look at these different trading strategies to improve overall portfolio returns.
First principles – what exactly are we trading?
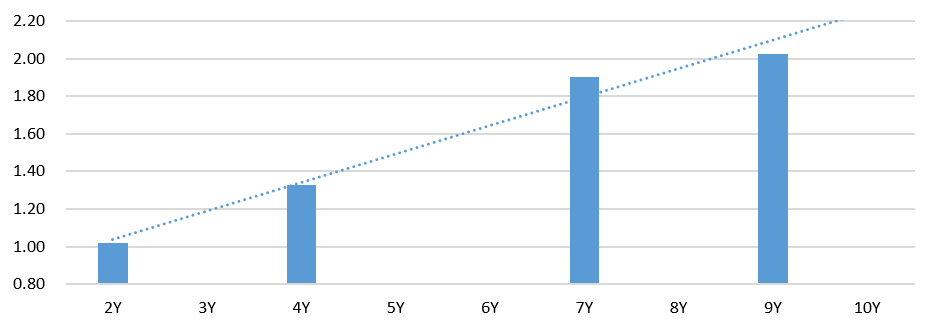
Step one is understanding that each corporate bond can be broken into its constituent parts. For example, the following four Woolworths bonds (green dots on the chart) can be deconstructed into a risk-free rate, a swap spread, and a credit spread as follows:
Figure 1: AUD swaps and government bond yield curves, 4 May 2023

Source: Bloomberg
The first Woolworths bond, maturing in around 2 years, is currently yielding 4.1%. An equivalent maturity government bond yields just 3.1%. The additional pick-up, or spread, that investors currently require to buy the Woolworths bond is around 1% or
100 basis points (bps). This makes intuitive sense, as Woolworths corporate risk should be priced higher than lending to the government and aligns with the big gap in credit ratings between the two entities (AAA on the government compared with BBB
on Woolworths).
We can also see that the longer you lend to Woolworths, the higher your compensation in terms of credit spread. However, the additional compensation over time periods does not increase in a purely linear fashion. A casual glance at the yield chart would
suggest that the pick of the Woolworths bonds would be those trading above the linear yield trend line (the 2-year and the 7-year), with the 4-year bond looking the least attractive.
This misses a key issue, however, and that is the shape of the risk-free curve. Currently, 3 and 4-year government bonds are yielding less than 2-year government bonds, based on the market’s expectation of the RBA cash rate in the near-future. This
dynamic in the risk-free curve lowers the yield on the 4-year Woolworths bond, all else equal. If we strip out the shape of the risk-free yield curve and look exclusively at the additional spread on offer across the Woolworths bonds, we find that
the 4-year bond – from a credit spread perspective – is trading in line with the broader spread curve, and is not actually ‘expensive’, which is what the yield chart above suggested:
Figure 2: Woolworths bonds credit spread (%)
 Source: Bloomberg
In fact, on a credit spread basis, the 7-year bond looks like the pick of the bunch as it is trading well above the fitted line, whereas the rate of additional compensation drops off as you move into the 9-year bond (even though your overall yield is
still higher, as per our first chart).
A portfolio manager wanting to isolate the attractive credit spread of the 7-year bond would purchase it and hedge the exposure to the risk-free rate with a simultaneous government bond sale, selling bond futures or entering into a paid fixed rate swap.
The mechanics and rationale for each of these strategies is beyond the scope of this note, but it shows that corporate bond fund managers have ample methods of isolating and trading credit risk, as opposed to conflating a number of idiosyncratic factors
into a single buy or sell trade.
The moral of the story, up until this point anyway, is to know what you are buying i.e. the split between the appeal of the risk-free rate and credit spread at a particular point on the curve. Credit risk and government yields respond to different factors
– the former is related to risk sentiment and corporate fundamentals, while the latter are subject to broad economic data, monetary policy, fiscal policy etc.
How to use this knowledge
Understanding these ideas and how other parts of the market invest in the same bonds as you do can influence your decision-making when it comes to buying and selling.
A very timely example is for investors that trade in the US corporate bond market, due to the more severe inversion of the risk-free yield curve on account of investors pricing in a recession and near-term rate cuts from the Fed.
Let’s look at the current Fortescue Metals USD yield curve against the US risk-free yield curve:
Figure 3: Fortescue and US risk-free rate yield curves, 4 May 2023
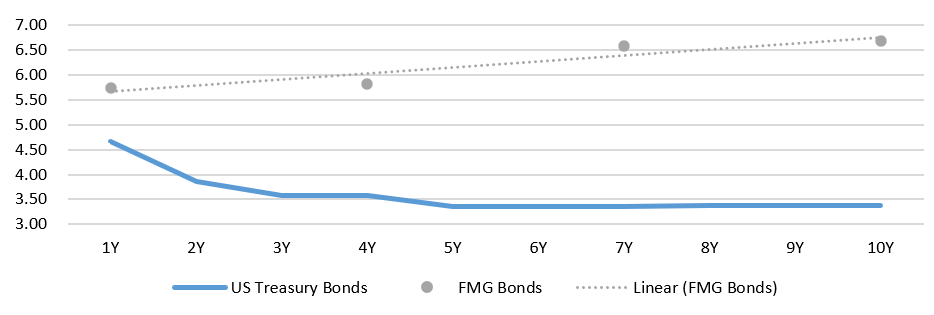 Source: Bloomberg
Right now, a holder of the 4-year FMG bond could sell and reinvest into the 1-year bond without giving up any yield. However, this is purely a function of the shape of the risk-free curve, and not a trade based on credit spreads, where the 1-year spread
is below the fitted spread curve:
Figure 4: Fortescue bonds credit spreads (%), 4 May 2023
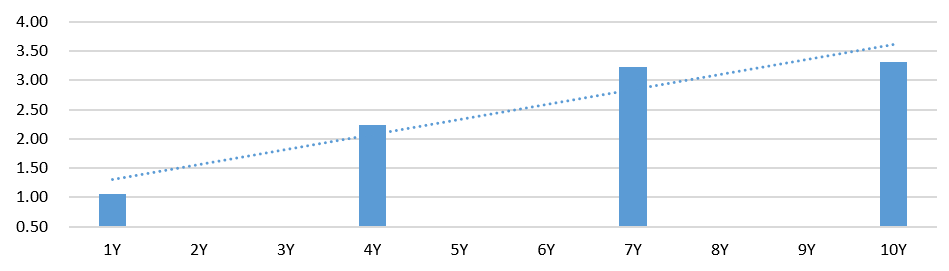 Source: Bloomberg
The 7-year bond also appears much better value than the 10-year bond in spread terms, while the overall yields on offer are comparable. The risk-free curve and the credit spread both stand out as attractive compared with the longer-dated bond, so this
would be a good candidate for a switch.
These are the basics across an individual issuer’s curve, but the exercise can be extended to trading across different issuers and sectors, incorporating not only a view on relative value, but also evolving corporate fundamentals. This is where
things get interesting, with a wider opportunity set to capitalise on shifting credit spreads.
Paring fundamentals and relative value
Credit spreads tend to trade with a correlation to equities so when the outlook weakens, share prices fall and credit spreads widen:
Figure 5: AusBond Index spread vs ASX 200 index value, 4 May 2023
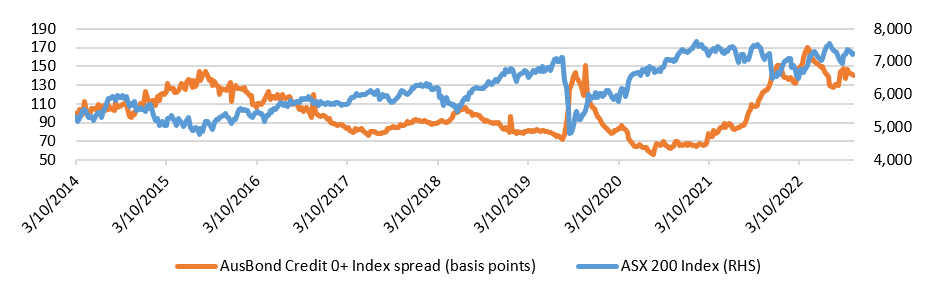 Source: Bloomberg
This happens at the index level (as per above, where one could argue that credit spreads are optically attractive compared with prior periods when the ASX 200 was at similar levels) and also at the issuer and sector levels, just like stocks. Naturally,
some of the more interesting credit opportunities are in segments that have been in the headlines for the wrong reasons.
Bonus idea
One final idea that looks interesting also comes on the back of negative sentiment for one particular company compared with potential complacency regarding the other company.
Downer Group has gone through an awful twelve months on account of a major contract gone wrong alongside some questionable accounting practices – to be clear, never a good thing! However, these are now well publicised and arguably in the price,
whilst the new CEO has cleared the deck with a number of high-level departures in the last few months. The recent Investor Day was focused on improving controllable factors and the equity is up around 20% since the last negative revelation, whereas
the credit spread has widened around 50bps to around 300bps.
Perhaps most importantly, these sorts of large contractors rely on an Investment Grade (IG) credit rating to be viewed as a reliable counterparty when it comes to tendering for large contracts (especially government ones), and management has recently
publicly referred to the IG credit rating as one of just four ‘Foundational Strengths’ of the business. If that is the case, then this short-dated bond should be viewed as money-good and as an interesting opportunity to generate a
c6% yield to maturity on a bond shorter than three years.
Conclusion
With the ability to actively trade bonds, rather than waiting for their maturity date, investors are able to incorporate specific strategies to potentially improve the portfolio's overall returns.